Many organizations know they need a better way to manage their data, but they don’t know where to start. A data maturity model can be a great tool. Firstly, it can help you quickly assess and improve your data maturity. Secondly, it can break down a large, complex data initiative into small, attainable milestones. Most important, you will see that no matter where you’re starting from, you can reach your data goals—one step at a time.
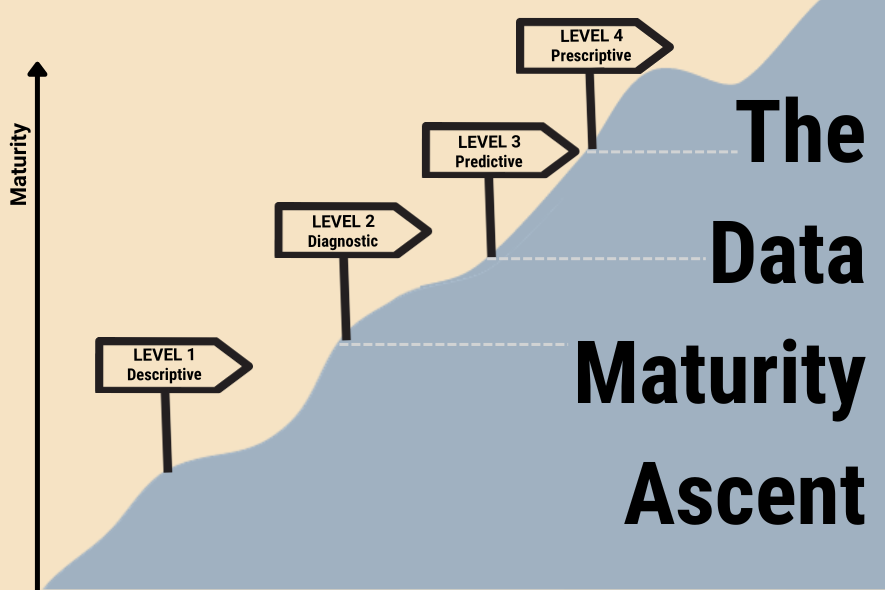
In this article, we’ll walk you through a data maturity model we call the “data maturity ascent,” which is based on Gartner’s Analytics Maturity Model. You’ll see what your business would look like in each of the four stages of data maturity and what you need to ascend to the next level.
And if you need some hands-on support along the way, drop us a line. As data consultants, our team has helped a number of organizations understand how to get started and advance on their data journey. We can help you chart a path forward, then help you get there. So think of us as a trusted guide for your data maturity ascent. Your data sherpa, if you will. 🙂
Let’s start climbing!
Level 1: Descriptive Analytics
Level 1 is the most important step of your data maturity ascent. It lays the groundwork for everything that follows. You will create your roadmap, decide on your tools, and develop your data culture.
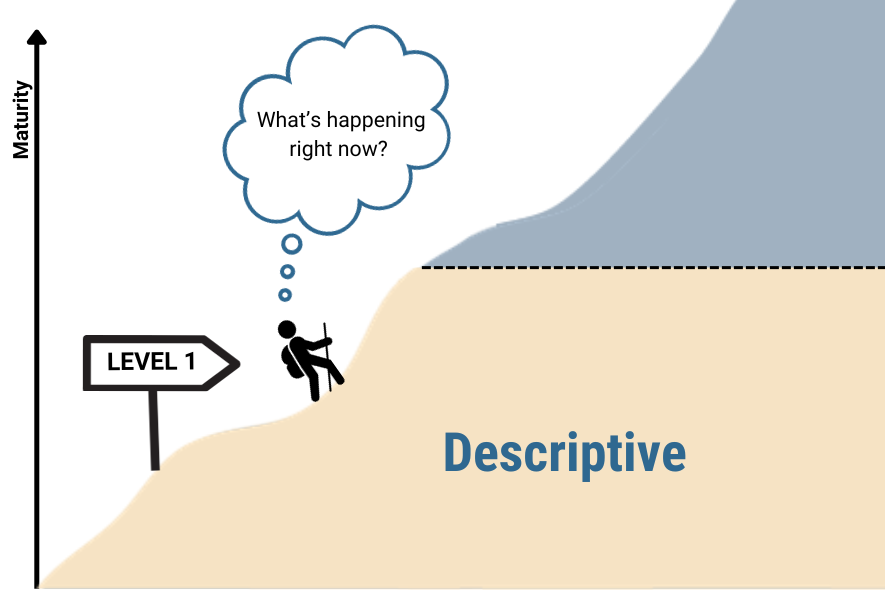
What are descriptive analytics?
“Descriptive analytics” means that you can describe what’s happening across your business. You’re able to use current and historical data to measure performance, see basic trends, and identify areas of strength or weakness.
For example, descriptive analytics enable your organization to answer questions like:
- How much revenue has your business generated year-to-date?
- Are you tracking against your operational KPIs?
- Is your target audience engaging with marketing content across various channels?
- How is your product doing? Are customers using different features and components?
- Are you fulfilling your SLAs and customer needs?
Although a lot of organizations have some type of descriptive analytics in place, it’s often not sufficient for where their business is and where they want to go. Other organizations are starting from ground zero and building their first-ever formalized data program. Still others are climbing out of the “trough of disillusionment” after a failed data initiative, determined to do it right this time.
The #1 Thing You Need for a Successful Data Maturity Ascent
In Level 1, you’ll take the most important step in your entire ascent: building a modern data stack. A modern data stack is the foundation for your entire data journey. It will help you develop the fundamental capabilities you need to continue advancing your data maturity.
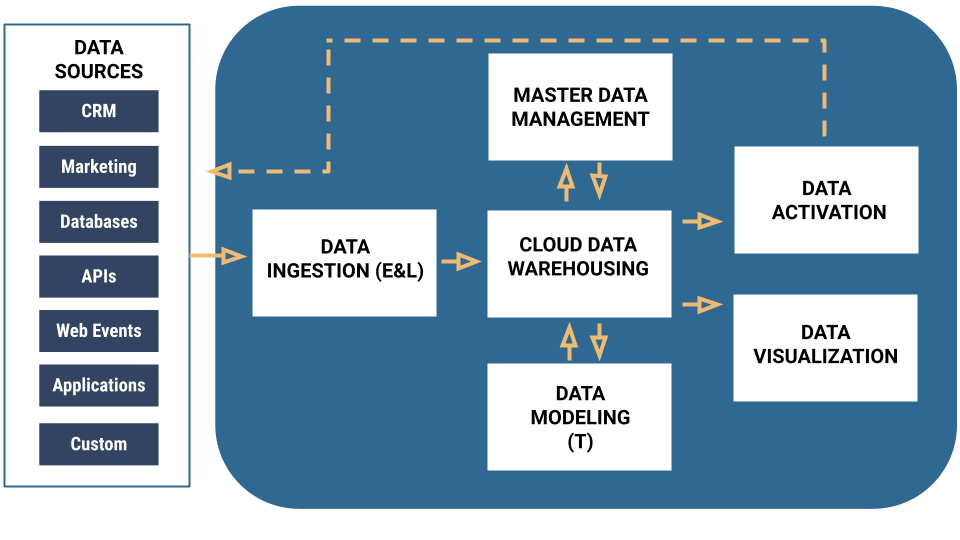
As shown above, a full modern data stack takes disparate data sources and ingests them into a centralized location: your cloud data warehouse.
During this phase, you will accomplish several major milestones, such as:
- Gather your most important data sources
- Automate the flow of data to a cloud data platform (like Snowflake or Databricks)
- Develop visual dashboards with a BI tool (like Sigma or Looker)
- Show stakeholders the value of using insights for decision making
Why You Need a Full Modern Data Stack
Have you been in a situation where one person is looking at one sales number and someone else is looking at another number? With a modern data stack, everyone is looking at the same information and has the same context and understanding. As a result, you’ll no longer need to hunt down 25 people and cobble together 50 excel spreadsheets to find an answer to a question. All the data will be flowing automatically.
For instance, with a full modern data stack, you can:
- Create a single source of truth to get everyone on the same page
- Quickly understand what’s happening in your business
- Focus your attention on areas that need to be addressed
- Arm everyone with insights to make informed decisions
Build a modern data stack and you’re 60% of the way there.
Planning for the Journey
When Data Clymer first starts working with clients, it’s often to help them reach Level 1. One of the most common questions we hear is, “How long will this take?” It depends on a number of factors. How heavily invested are you? Is your organization committed to building out these capabilities? Does your leadership team understand the need to make data-driven decisions across the business?
Building a modern data stack can be done in a matter of months if you’re willing to invest time and money into it. But without buy-in and commitment, it can take years. When there is a legacy data warehouse environment that needs to be migrated, it can also take longer because you’ll have more stakeholders and inertia to overcome.
Pro Tip: How to Fast-Track Your Ascent
Cultural buy-in is your secret advantage. Your entire organization needs to be aware of your data initiative and willing (maybe even eager!) to start using data in day-to-day business processes. If you were climbing a mountain, this would be the planning piece. It’s the equivalent of choosing your climbing partners and making sure everyone has the proper training and equipment before the trek begins.
The universal language of data gets everyone on the same page and moving in the same direction.
Once teams start to see results, it will turn heads. Stakeholders will begin to understand that a modern infrastructure is much faster and easier. People and teams will have more capabilities than they had before. These “small wins” drive alignment and encourage buy-in. Before you know it, everyone will want access to descriptive analytics.
Build Momentum with These Popular Use Cases
The best way to help people across your organization understand the business value of data is to hone in on use cases. Pick priority use cases and prove them out.
Here are some reporting use case ideas to get you started:
Example #1: Executive Dashboard
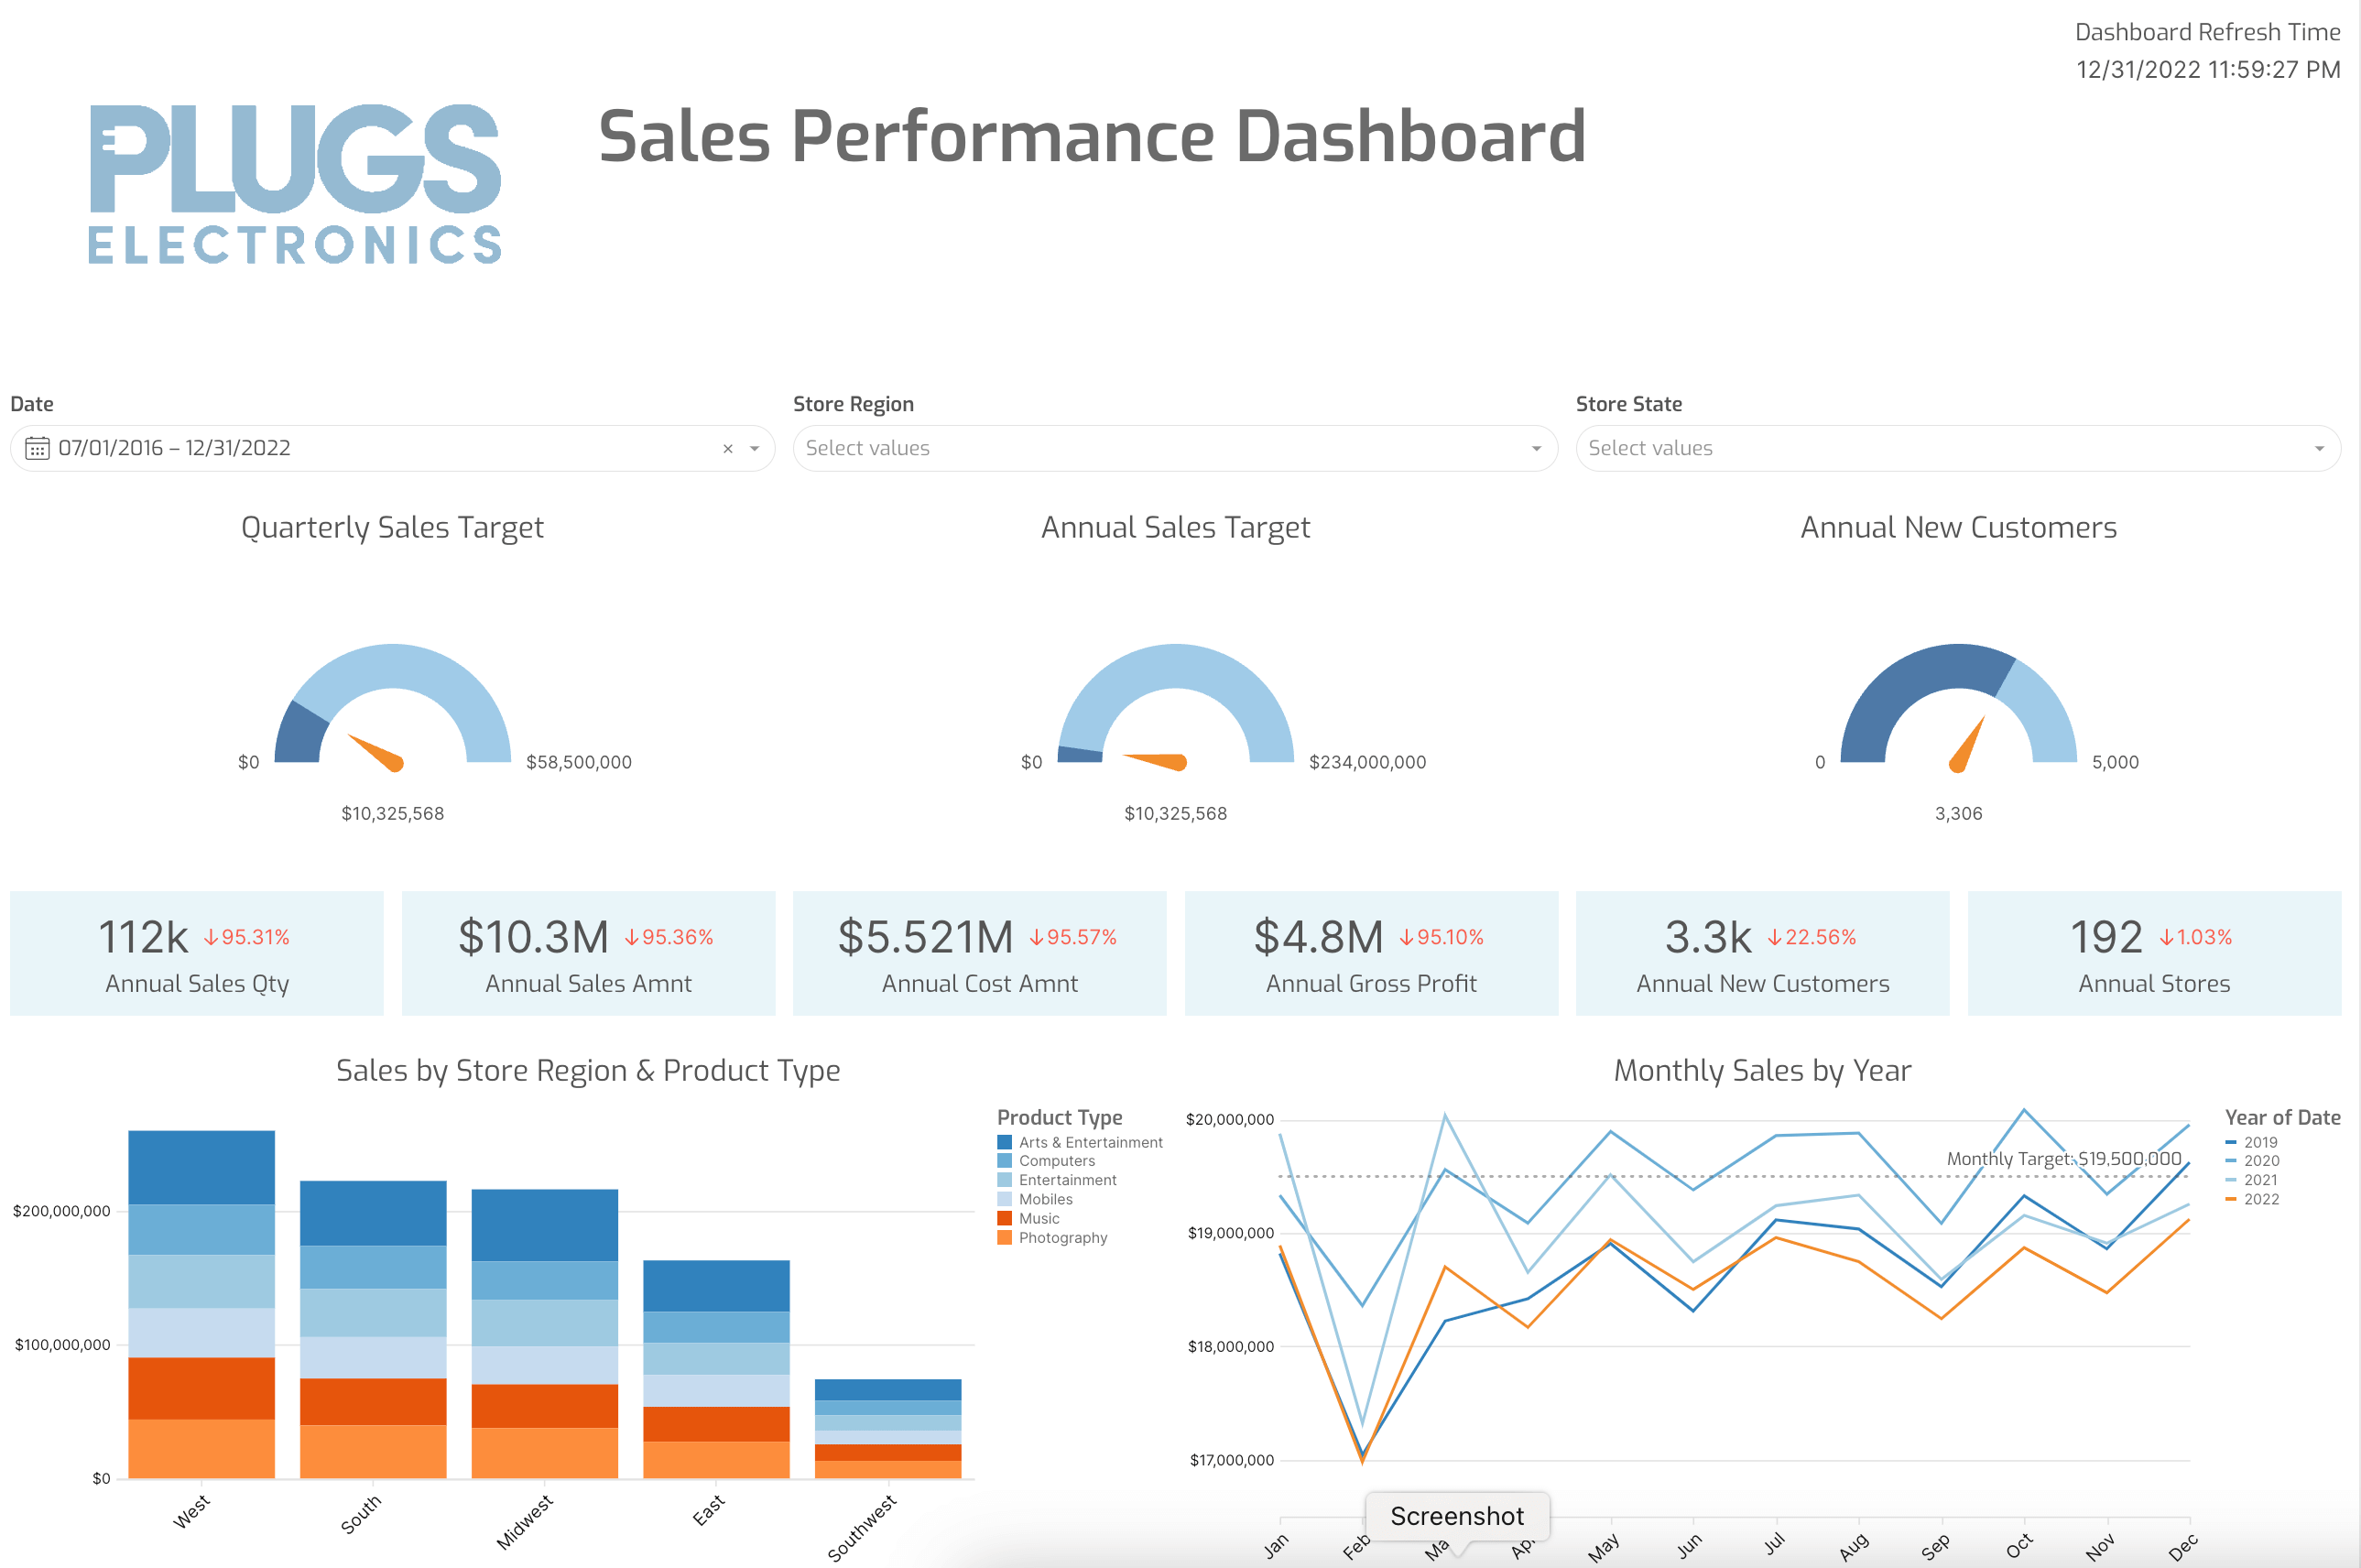
As shown above, an executive dashboard enables you to collect your major KPIs in one place. Depending on the size of your organization, this could be for one specific department or for your entire company. You can include top-level metrics like “total revenue,” “total impressions,” or “conversion rate”—whatever is most critical to your stakeholders. Add a date filter so users can specify the time window they’re interested in.
Common examples of executive dashboards include:
- Sales: Show total sales for a given time period, period-over-period growth, percent towards sales goal, and slice the data by dimensions like client type and industry.
- Marketing: Show KPIs like total impressions, total clicks, total CPM, total CPC, and so on. These metrics are commonly sliced by channel and platform.
Example #2: Drill Down Dashboard
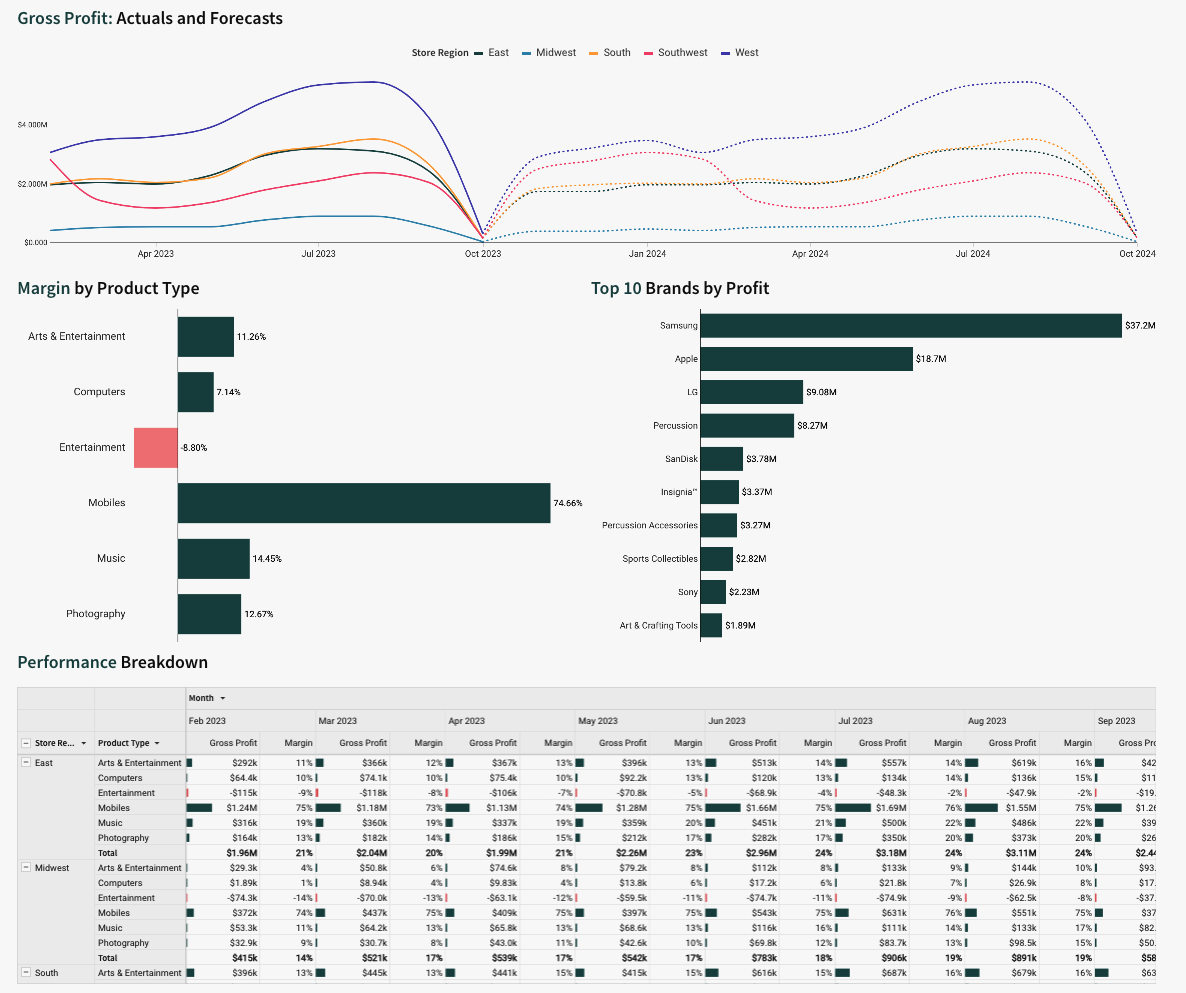
As you can see, this type of dashboard provides the nitty-gritty details behind the top-level metrics found in an executive dashboard. This is helpful when a stakeholder wants to look at the underlying data behind a graph or high-level metric, and often takes the form of a detailed tabular report.
A few examples of drill-down dashboards include:
- Sales: Display daily sales data in a table with details like order date, customer, price, and products.
- Marketing: Show marketing KPIs at the creative asset level, including campaign dates and creative metadata.
- Supply Chain: Show executives a high-level overview of major business KPIs like product turnover, while enabling operations to drill down and get insights on the entire cycle.
If you’re struggling to get the ball rolling and get approval for your data initiative, we can help. In fact, we’ve worked with many data champions to develop messaging that helps them sell their data projects to their bosses and other stakeholders.
The Next Level of Your Climb
Once your organization can easily answer descriptive questions, it’s natural for people to start asking deeper, more technical questions. As a result, the value you unlock in the descriptive layer creates momentum that builds on itself. Data leads to questions, questions lead to more data, and more data leads to more advanced questions.
And with that, you’re ready to move on to Level 2!
Level 1 Checkpoints
- ✓ Built a modern data stack
✓ Created a centralized, automated data flow to replace data silos and spreadsheets
✓ Aligned stakeholders so everyone is looking at the same information
✓ Made insights easily accessible across your organization