Data Visualization Services
Gain insights to enable faster decision making with expert data visualization services
What is Data Visualization?
Data visualization is the art of presenting data insights in a clear, effective manner through visual formats like pie charts, graphs, and diagrams. It allows users to analyze data, identify patterns, and draw meaningful conclusions.
Data Visualization Consulting
Our data visualization consulting experts help organizations across diverse industries use data visualization to drive business outcomes. We help clients develop interactive dashboards and reports to effectively convey information, break down data silos, and facilitate data-driven decision making. Cutting-edge data visualization technologies enable our clients to easily understand complex data sets, identify trends, and make informed decisions to drive their business forward.
What Our Data Visualization Experts Do
Reporting
Build scalable, automated reports and dashboards to get your data into the right hands.
Embedded Dashboards
Embed dashboards in your customer-facing products to give you a competitive advantage.
Analytics
Turn data into actionable, accessible, and timely insights to support decision making.
Custom Visualizations
Customize visualizations based on your organization’s specific needs, objectives, and style.
Data Democratization
Deliver data in a ready-to-use state to data consumers across the organization.
Data Quality
Measure the state of your data by determining the accuracy, consistency, and validity to ensure the data is actionable.
How Data Visualization Services Set You Up For Success
With data visualization consulting, businesses can unlock value right away. Organizations see numerous benefits, from improving data quality and trust to enabling teams with self-service analytics. Data visualization can help businesses:
- Increase speed to insight
- Save time and money with automated analysis
- Enhance scalability
- Improve data quality
- Make informed decisions based on historical data

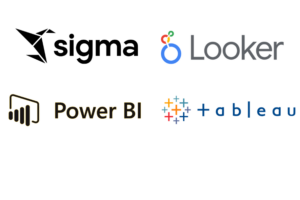
Implementing the Best Modern Data Visualization Technologies
Whether it’s building robust dashboards to enable timely data-driven decision making, performing a health check to improve dashboard performance, or conducting a side-by-side BI tool evaluation, our data visualization experts are here to help. We have deep expertise in Sigma, Looker, PowerBI, Tableau, and other leading data visualization technologies.