Building a modern data program might seem overwhelming, especially if you have limited or no access to data resources. In order to help organizations get started, we often recommend using a data maturity model that breaks your journey into milestones and maturity levels. Previously, we explained how to excel in ‘Data Maturity Level 1’ by developing descriptive analytics to gain a deeper understanding of your business’s current status. Most importantly, you laid the groundwork by establishing a modern data infrastructure, which forms the core of your entire journey.
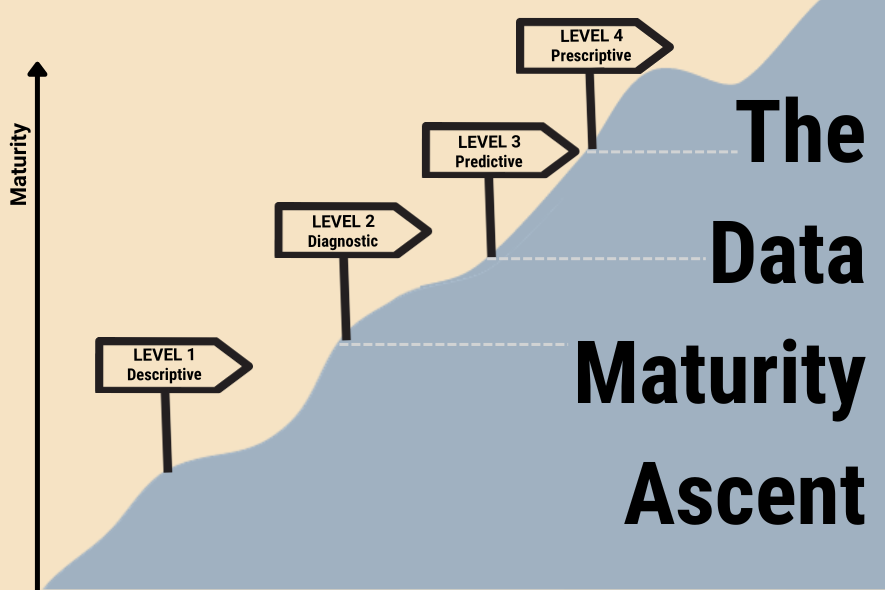
Now, let’s delve into the next three data maturity levels:
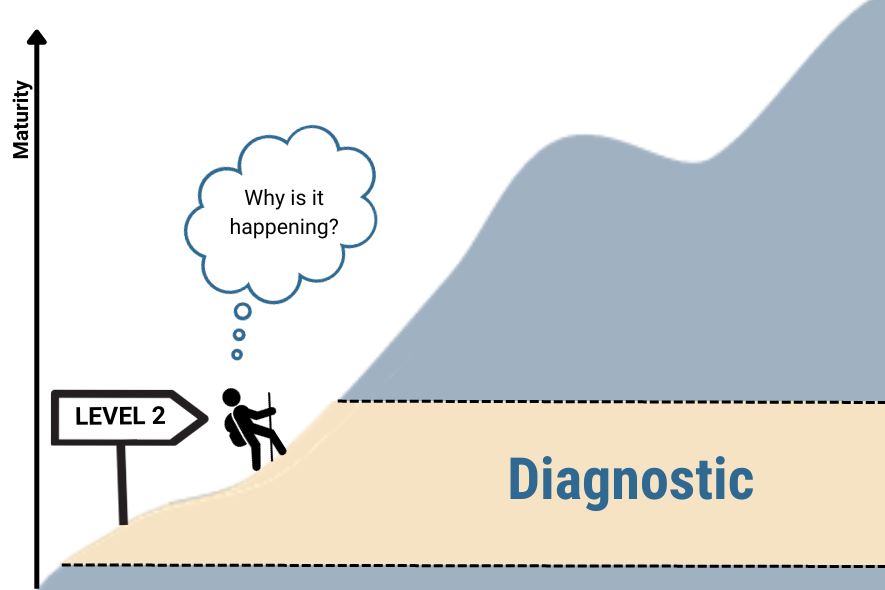
- Diagnostic Analytics (Level 2)
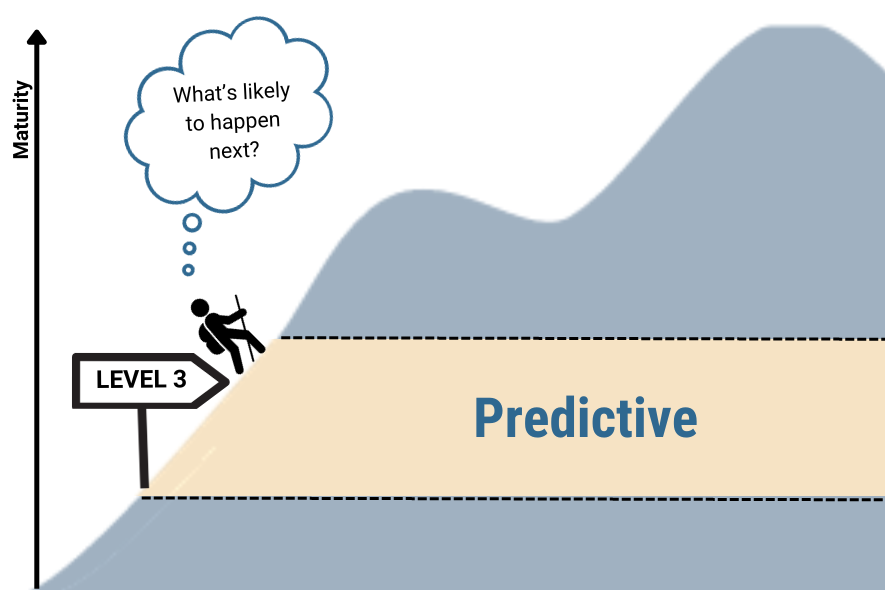
- Predictive Analytics (Level 3)
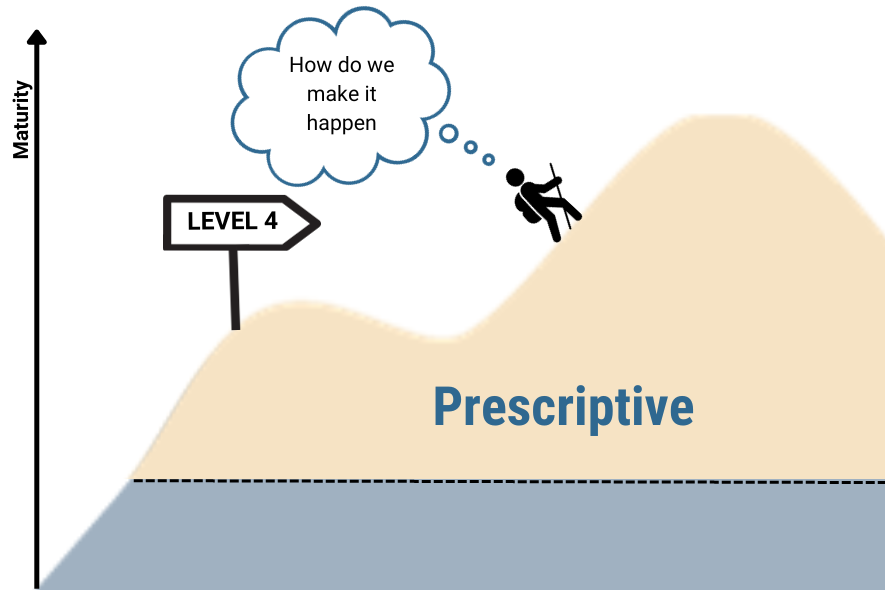
- Prescriptive Analytics (Level 4)
This is where the real excitement begins! Instead of just using data to grasp what’s happening, you’ll discover how to harness data to achieve the outcomes your business desires. As your data maturity grows, you’ll transition from passive observation to active decision-making.
Let’s keep climbing the data maturity levels!
Level 2: Diagnostic Analytics
In Level 2, you go beyond understanding what happened in your business to uncovering why it happened.
Diagnostic analytics empower you to pinpoint the causes behind business events and take effective action to address them. By consolidating multiple data sources into one accessible platform, you can easily identify correlations, trends, patterns, and dependencies.
Diagnostic data guides your attention to places where you can take action.
In this level, teams across your organization are using data to inform decisions and actions. And that’s where the real value lies. After all, it’s great to be able to describe a revenue spike—but don’t you really want to know why revenue spiked so you can replicate the effect?
For instance, if your marketing team can attribute a spike in product sales to a trending social conversation, they can intensify their campaign efforts while the trend is still relevant. Similarly, when the operations team can link a drop in revenue to a manufacturing issue, they can swiftly address it to minimize profit losses.
Level 2 Checkpoints:
- You’ve built effective visualizations that teams use regularly
- You’re using blended data sets to gain a deeper understanding of your business
- You can drill down to root-causes and isolate all confounding information
- Stakeholders are taking action based on your data
Level 3: Predictive Analytics
In Level 3, analytics are driving more of your decisions and actions. Your analyses are becoming more complex and sophisticated. For example, instead of looking at facts, you’re looking at time series analysis and other trends to make predictions about what your next move should be.
Predictive analytics involves using historical data to forecast future events with increasing certainty. By employing machine learning techniques, you can handle large volumes of data and generate likely predictions.
You’re now delving into the realm of advanced statistical methods, machine learning, and other tools to thoroughly analyze past data and make informed predictions about the future.
Furthermore, you’re enhancing your data by incorporating external sources. Instead of solely relying on internal business data, you’re incorporating macroeconomic data, environmental conditions, and other factors that may impact your business. Consider a baseball team predicting a dip in attendance due to an impending storm. How might they counteract this? Similarly, toy manufacturers can anticipate a surge in sales every November and December—how will they capitalize on it?
Although these are basic examples, you’ll uncover profound ‘aha’ moments as you advance in this level of analysis, even discovering unexpected connections. Predictive analytics often reveal new insights that transform the way businesses think and operate.
While many business professionals rely on their instincts and expertise, having data to support those insights boosts your foresight and confidence. As you refine and validate your assumptions, your confidence and accuracy will grow. This means your teams can spend less time on routine decisions and more time exploring innovative opportunities.
Level 3 Checkpoints:
- Successfully built a robust set of highly effective visualizations
- Can confidently predict outcomes using patterns and algorithms
- Developed ML models to apply to various business applications
- You’re using advanced technology to automate some decision making
Level 4: Prescriptive Analytics
Congratulations! You’ve reached the peak of your data maturity ascent. This is what the most advanced organizations in the world are doing. AI chatbots are handling customer requests for you and you’re automating tasks and decisions with a high level of confidence.
“Prescriptive analytics” means you’re using near real-time data to drive decisions and develop predictive models around business outcomes. Taking this approach across all business practices, you’re effectively looking out and forecasting into the future and making your decisions based on that. You’re looking at results that might happen a few months out, but taking action now. You’re using data to prescribe the future you want to create.
To confidently deploy prescriptive analytics at scale, you need historical data of past successes and failures.
Here are a couple examples of using prescriptive data to drive positive outcomes.
Example 1: Optimize profit with adjustable pricing
Organizations can dynamically adjust event pricing to meet demand. In order to unlock this type of dynamic pricing, you need to build up a whole foundation with historical models. Predictive data enables you to confidently say, “When demand spikes by x, we can increase prices by y.”
Example 2: Prevent churn with automated and personalized offers
Organizations with subscription cycles often implement this with high levels of success. They watch for early triggers that indicate high churn rates and take action to prevent it well in advance.
To do this at scale, they need a number of things. First, they need to be able to identify the flags or triggers that indicate a customer has reached a certain churn risk. Next, they have to know what action is likely to retain them as a customer, whether it’s a specific promotion or personalized message that is highly likely to keep a customer engaged.
Level 4 Checkpoints:
- Advanced data science approach
- Robust foundation of historical models
- Confidently automating many tasks and decisions
- Advanced analytical techniques based on near real-time data
Your Data Maturity Ascent at a Glance
There you have it! The four data maturity levels are a powerful way to understand and improve your data maturity.
What does this look like in real life?
To illustrate one example, let’s imagine your organization wants to improve customer retention. Here’s how your analyses and capabilities would advance throughout your data maturity ascent.
- What is our customer churn rate?
- Why are these customers churning?
- How can we prevent them from churning?
- What actions can we automate to successfully re-engage any customer that displays an initial churn trigger?
How Data Maturity Delivers Value to Your Business
At the end of the day, your job as a data leader is to improve every other person’s ability to do their job.
You’re making it easier for marketing to know where to invest valuable dollars. You’re making it easier for customer success to know when and how to reach out to customers. And you’re making it easier for executives to make tough decisions based on economic forecasts.
Furthermore, data maturity drives a culture of growth and innovation by:
- Encouraging people to ask more advanced questions
- Reducing the time and overhead spent thinking about recurring scenarios
- Freeing up mindshare to explore out-of-the-box solutions
- Driving more consistent business results
Until you have the foundational elements in place, it’s very difficult to do all this. But once you have them, it becomes easier and easier.
And it all starts with building a modern data stack.
You Might Also Like: