There are obvious benefits to trending aspects of your business over time. But what if the data does not lend itself easily to trending, like when totals for one date relies on information from prior dates? This is often the case with inventory data.
We’ll show you one solution that we developed using Looker, one of our favorite BI and analytics tools. We’ll use an example from a fictitious company called “Anything’s Popsicle Inc.” that sells a myriad of puny popsicle flavors. (And before you say it, yes, it is very unfortunate that this company does not exist.)
🍦 Pop’s Sticky Problem
The owner and operator, Pops Icsleson, creates popsicles in his kitchen and then stores them in a large freezer in his garage. Pops is a big IoT fan, so he uses popsicle sticks with embedded RFID tags that allow his overly complex inventory management system to automatically record popsicle movement in and out of his freezer.
Unfortunately, the system only logs incremental changes to the quantity every day, like this:

Pops wants to observe how each item in his inventory has fluctuated throughout the year. But if he tries to write a simple report that totals the quantity per day, it looks like this:

🧊 The Cold Truth
Yikes. Do you see the negative and wildly fluctuating inventory values in the chart above? That’s because to know how many popsicles he had on a certain date, he has to sum all the incremental additions and subtractions to his inventory up to that date. Before you get brain freeze, don’t worry! We solved this using basic SQL and several Looker features.
🥄 Churning the Data
First, we generated a list of all calendar dates from the day Pops started recording his popsicle inventory. We created a persisted derived table in Looker in which we cross joined the date list to a list of all his flavors.

The result is a table with one row for every possible date and flavor combination. For simplicity, he has only six popsicle flavors. We’ll call this view flavor_date_dim and it is the backbone of the report:

Next, we could create a persisted derived table to sum up the total inventory for each item on each date in flavor_date_dim… but most companies have a lot more than 6 items and watching this report load would be like watching flavored water freeze. So, for performance reasons we recreated two versions of our flavor_date_dim view:
- One with 1 row per flavor per month (with associated beginning and end dates)
- Another with 1 row per flavor per week.
We only need these two time-frames because that’s all Pops needs to understand his inventory trends over time.
For example, the monthly view is built like this:


It’s important that each view have the same names for the appropriate time period. Here, we used report_date_start and report_date_end.
We used Looker’s liquid logic to sum up the inventory by week or by month depending on the time frame parameter that the end user selects. In addition to inventory sums, we also obtained the primary key for the entry pertaining to the last entries in the report period in order to join in non-aggregable details, such as the freezer location at the end of the month:
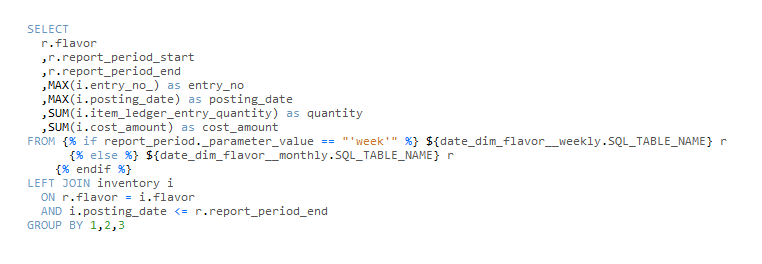
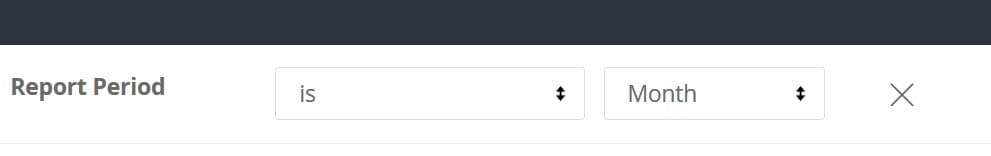
Now, we added report date start and end dimensions to our view as well as a parameter:

To the user this appears as a filter only field:
🍨 The Cherry On Top
Now Pops is happy. No more negative or wildly fluctuating inventory values. When he reviews his inventory, he selects his report type: monthly or weekly. Behind the scenes the base report is switched out.

Now those are what I call some sweet insights 😊
Need help with Looker? Schedule a Looker Health Check with Data Clymer’s team of Looker experts.
Rob Seaberg
Rob is a cloud data engineer specializing in SQL and python, data modeling, dashboarding, and business intelligence.