In this article, we will outline how we evolved the data culture for one of our food manufacturing clients by centralizing their data in a Snowflake data warehouse hosted on AWS and migrate their reporting infrastructure from spreadsheets to PowerBI. We will also discuss some detailed specifics around AWS-specific features and how we architected an optimal solution.
The Problem:
Data siloed in spreadsheets resulting in slower reporting and bottlenecked knowledge.
The Goal:
Single source of truth to track
- Industry trends
- Retail data
- Wholesale inventory
- Sales
The Solution:
As experts in architecting optimal solutions for our clients, we utilized the following technologies:
- AWS – Route 53, SES, S3, Lambda, AWS Glue, Amazon Athena, Amazon Forecast, and Amazon Eventbridge
- Snowflake
- Matillion ETL for Snowflake
- Power BI
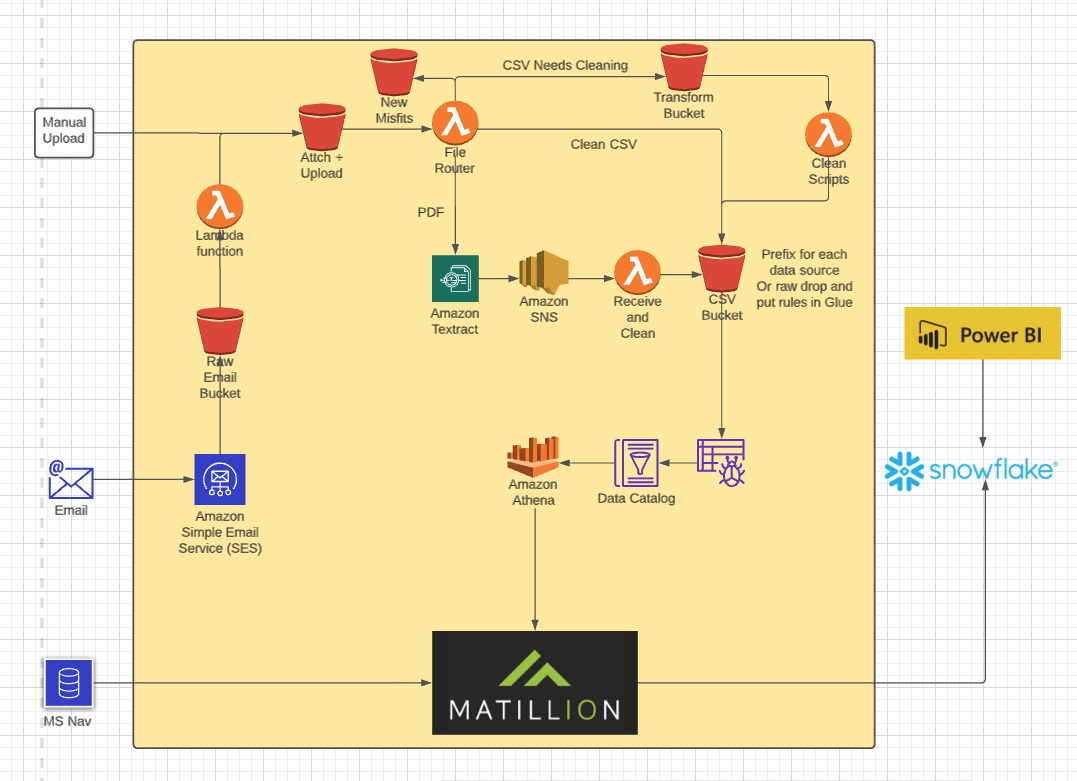
The file loading process is currently set up to ingest, csv, xlsx, and zip type file packages. These files are processed using an email automation process built using Route 53 and SES. Once the files are uploaded into their necessary S3 buckets, they are further processed with a lambda function that adds a timestamp column and transforms all files into CSVs which are organized into an S3 bucket that is able to be queried using a combination of AWS glue and Amazon Athena.
Once the data is able to be queried in Athena, we connect Matillion ETL to the Amazon Athena driver (3rd party driver requires additional setup). Matillion is then scheduled to run an incremental load each day on all of the tables in Athena and pick up the new records. These new records are then ingested into Snowflake where they are modeled into aggregate tables.
In addition there are several tables that are in a MSSQL server that are incrementally loaded each day using a Matillion ETL job that runs each morning. The tables in MSSQL are mirrored in Snowflake and this data is used in conjunction with the vendor data that was ingested from the csv/xlsx loading process. The combination of these 2 data sources are made into the primary data model that is used by Power BI for the main visualizations.
For the forecasting capabilities we created a process that sends a snapshot of the 4 main aggregate tables back to an S3 bucket from Snowflake on a weekly basis. Amazon Forecast is then scheduled to run on each of those 4 snapshots using Amazon Eventbridge. The forecasting outputs are then scheduled to be ingested into Snowflake the following day, using Matillion, where they are able to be visualized in Power BI.
The Results:
With all of this data in one place it enables more informed decisions regarding future order fulfillment for their customers. Specifically, for planning & forecasting manufacturing outputs. In addition, our client is able to visualize their existing sales and inventory data that was stored in MSSQL along with their vendors’ sales and inventory data that they had been receiving, but were not able to extract much value from.

About John
John is a full cloud data engineer with expertise in AWS, Tableau, and Matillion.