Every organization has goals that they need to track periodically. It is important to make these goals visible to the whole organization so everyone can contribute towards meeting them, with time to course correct if necessary. As the saying goes: “If you can’t measure it, you can’t improve it.”
Now, depending on how often these goals are updated from your executive team, that can lead to a lot of work. Looker is a world-class cloud business intelligence platform that makes it incredibly easy to track and visualize goals. In this article, we will share two methods for using Looker to track your progress against goals.
Method 1: Using Looker Table Calculations
The first method we will go over utilizes Looker’s table calculations feature. Let’s say we want to track quarterly revenue against our target.
Step 1:
We start by creating a Look that pulls in the current quarter’s revenue.
Step 2:
Next, we can create a table calculation which we will call “Current Quarter Goal.” In the table calculation we can hard code our goal value and set the format to “U.S. Dollars (0).”
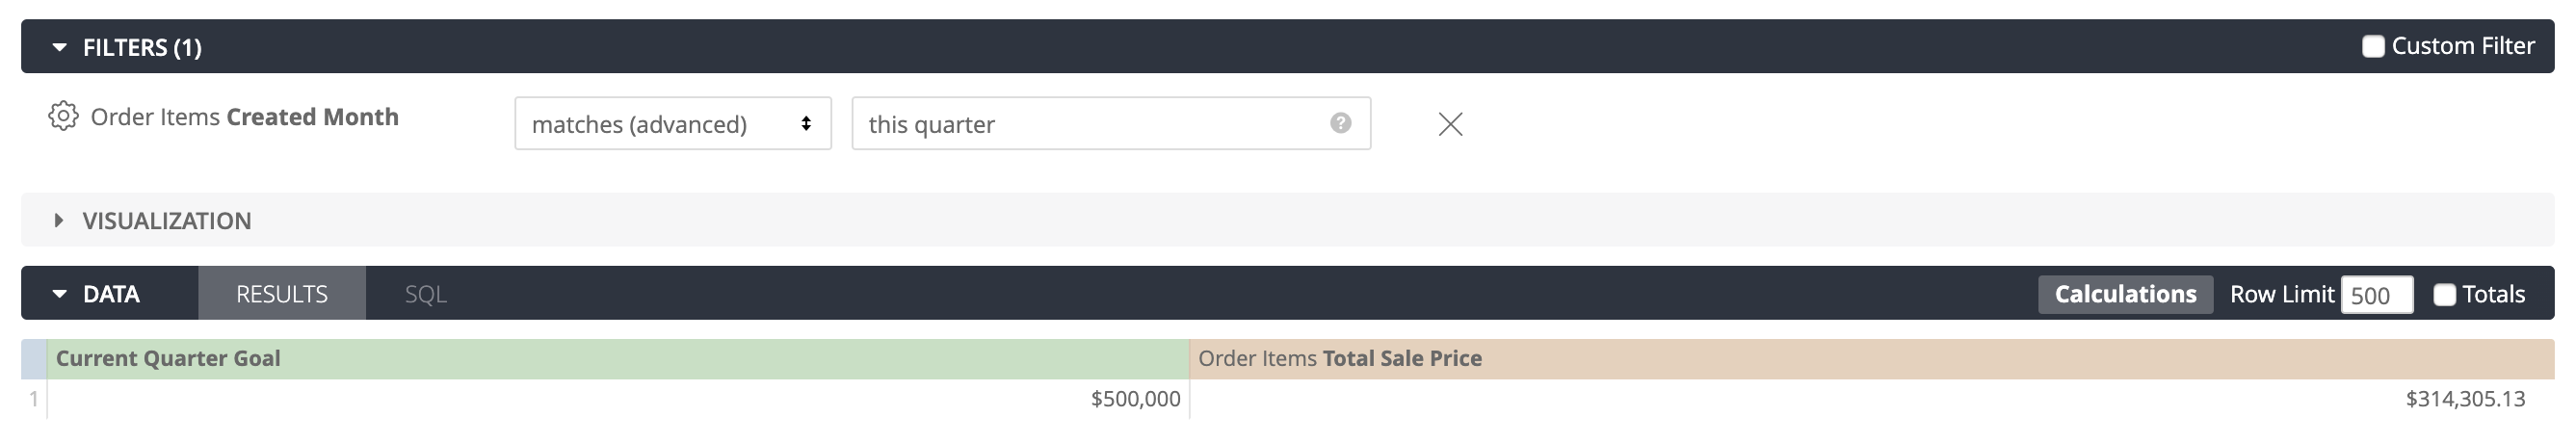
Step 3:
Select “Single Value” in the visualization panel and click on “Show Comparison.” This compares the value of the measure we have to the table calculation we just created.
Step 4:
Finally, we select “Calculate Progress (with Percentage)” for the Value Labels.
![]()
This is the quick and easy way to get a visualization set up on tracking goal data. This pattern can be applied to any set of data, whether it’s marketing, finance, product, or HR data. It is only practical, however, for high-level goals, since each goal must be maintained individually in separate table calculations.
But what if you have a larger number of goals or you just don’t want to maintain them as illustrated above? In the next section, we will go over a more advanced method that stores goal data directly in the data warehouse.
Method 2: Creating a Table
The idea is to create a table in the data warehouse where we track our goal numbers. This table can be updated over time either directly using SQL or, even better, by sourcing it from Google Sheets. Tools like Matillion, Fivetran, Stitch, or Panoply allow you to do that very easily. The benefit of Google Sheets is that someone less technical can update the goal data themselves without having to access the data warehouse.
Once the new table is complete, we can expose it in Looker as a view and join it to “actuals” data. That allows us to see “actuals” versus goals in the same query.
Step 1:
Create a table in the data warehouse that contains the following columns:
- ID
- Day of Week
- Weekday or Weekend
- Monthly GMV Goal
- Days in the Month
- Business day
- Business days into month
- Business days left in month
- Business days total in month
It should look something like this:
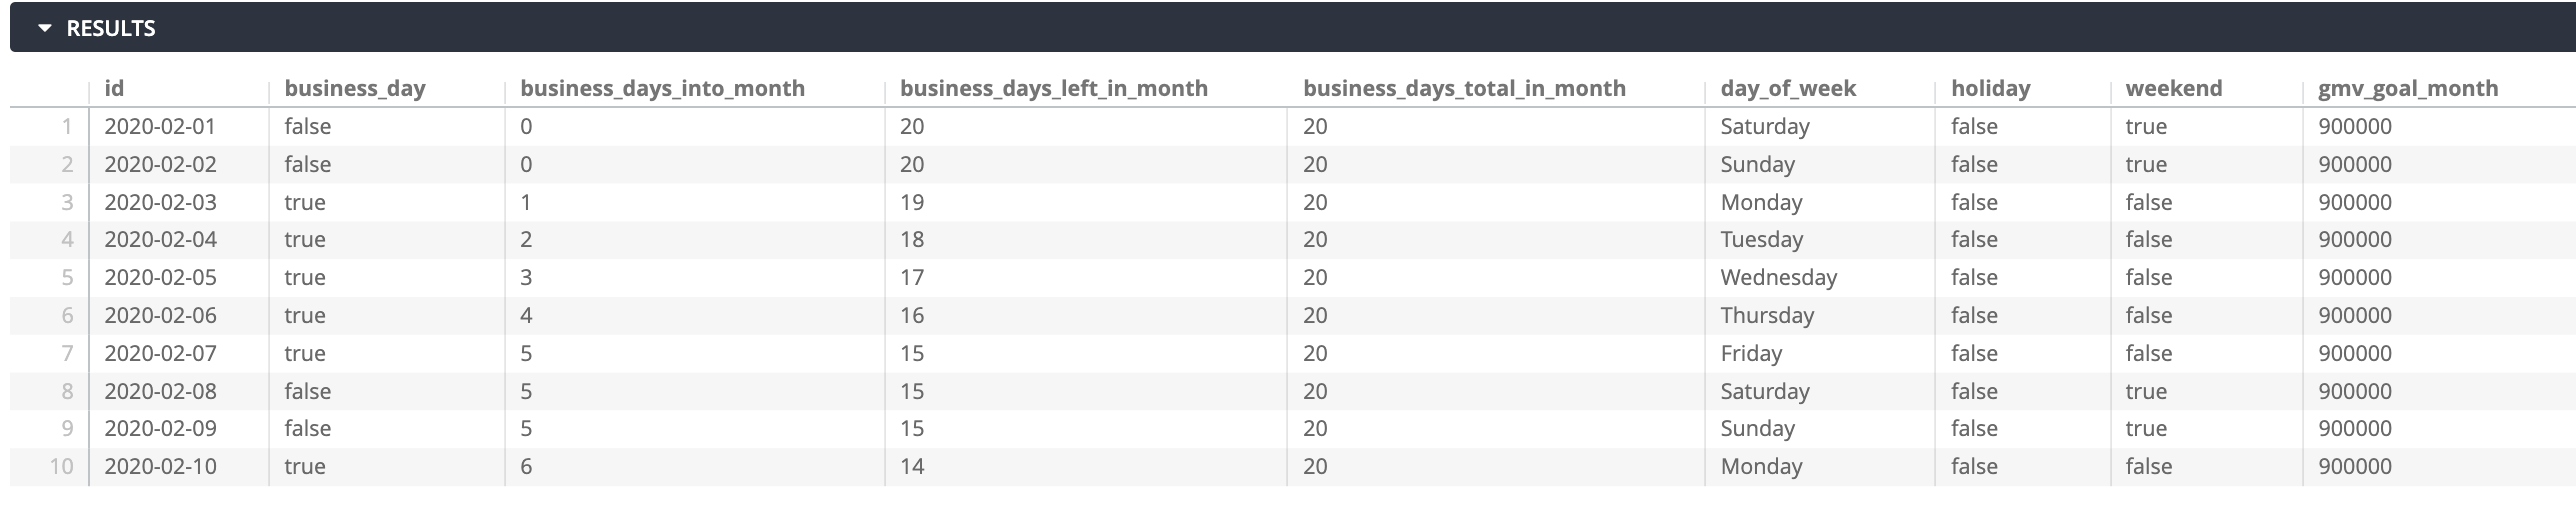
We want one row per day in our dates table so we have greater flexibility on comparing goals such as daily and monthly. The days in the month column allows us to calculate the daily goal value and can be useful for other analyses. There are additional columns that could be beneficial as well for more advanced use cases or if your business has seasonality such as “is_weekend”, “is_holiday” or “day of the week”.
Then create a view in Looker called “dates” and join that on your “actuals” table using the appropriate order date column. In this example our “id” column on the “dates” view is the actual date formatted as YYYY-MM-DD. Therefore, we join to the orders table on orders.created_date = dates.id. The relationship will be many_to_one since there can be many orders on a single day.
![]()
When we query this explore we can set up the dimensions and measures as follows to show our monthly progress to goal for multiple months. We can then add a table calculation which divides the GMV Goal Month by our measure Sum GMV to show the percent progress towards the goal.
![]()
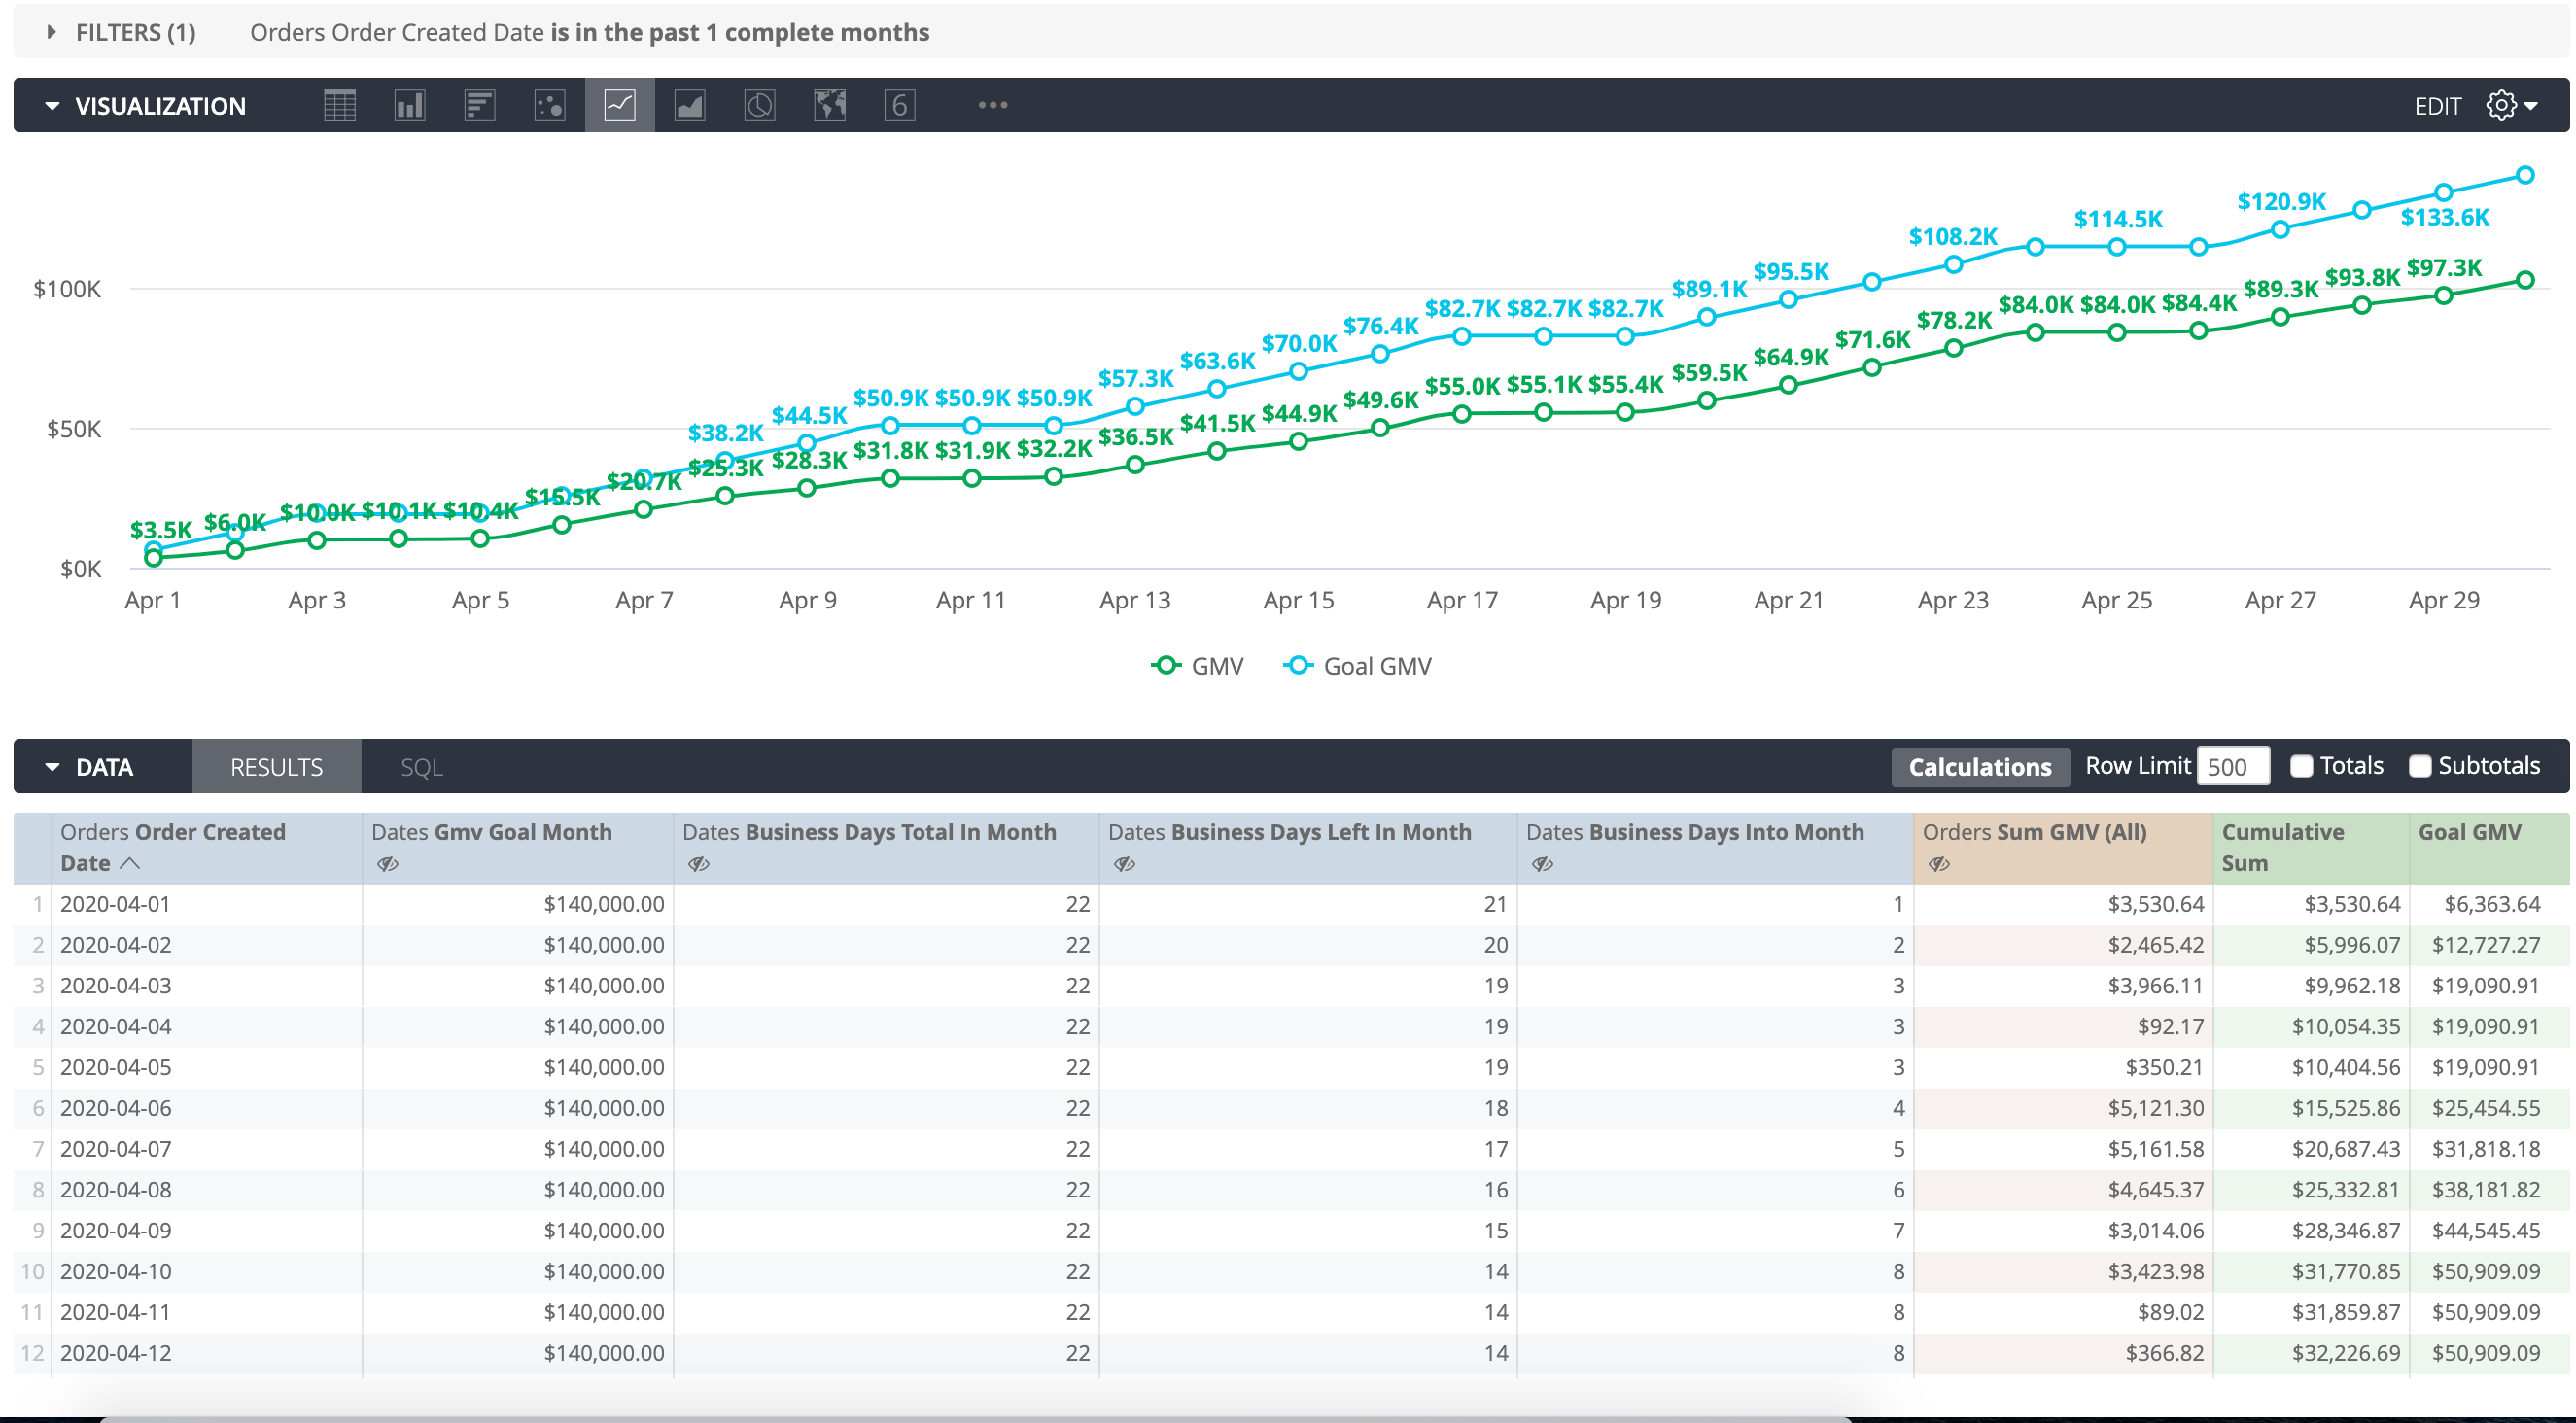
It’s often useful to see how we are tracking towards a monthly goal on a daily basis. We can accomplish this by allocating the monthly goal linearly across each business day and creating a daily visualization trend.
Continuing with our example, we do this by bringing in the order created date, GMV goal Month, and the business days columns into a Looker query. Next, we will create two table calculations. The first one is for the Cumulative Sum which takes a running total of the Sum GMV. The second table calculation is for Goal GMV, which is calculated as:
(abs(${dates.gmv_goal_month} / ${dates.business_days_total_in_month} * ${dates.business_days_into_month}) + (0 * ${cumulative_sum}))
The calculation works like this:
- The first line takes the GMV goal month and divides by the business days total in the month to give us a daily GMV goal number.
- Next, we multiply that number of business days into the month for us to get what our cumulative Goal GMV value should be for each day.
- The last part is to ensure that the table calculation is treated as a measure, so we add (0 * cumulative_sum). The net effect of this is just adding 0, but because we include a table calculation which references a measure, Looker will then treat our Goal GMV table calculation as a measure too. Otherwise, it will treat it as a dimension. We could have replaced cumulative_sum with the Sum GMV measure as well and we would arrive at the same result.
Now you have a scalable way to track progress against goals in Looker. This same method can be used for tracking progress of other items such as sales rep quotas, marketing ROI, or even hiring metrics.
You Might Also Like: