Automate Monitoring Matillion Tasks with the Matillion Task History API
A critical piece of any data pipeline that runs during an extract, load or transformation (ELT) process is being alerted to failures. Unfortunately, this is often overlooked and monitoring the health of a data pipeline can either be omitted altogether or fall as a manual responsibility to a member of a data team – the former can lead to invalid data, which means stakeholders losing trust, and the latter means time spent that could otherwise go towards impactful projects. This article will talk about taking Matillion’s Task History to the next level in order to prevent both of those scenarios from happening.
Task History: The UI
When a Matillion component runs, an entry gets recorded in the task history – this is a running log of what has and is currently running on a Matillion server. From Matillion’s UI, the task history can be used to show the task, when it started, when it completed and most importantly, whether it ended in success or failure (there is some other metadata about the environment, versioning etc).
This is a great utility when one is developing as they can view this information directly in Matillion’s interface to get quick feedback. But what about once jobs are running in a production environment? Imagine there are five scheduled jobs that run on a daily schedule between 3 and 5 AM, each made up of multiple individual components. When these jobs kick off, they appear in the task history UI as they are running and their status will update to success or failure once they complete. How would a team know if there were any failures unless someone was monitoring the Matillion instance in the middle of the night? By relying on the UI, it would take someone manually combing through the task history looking for components that ended in an error to identify what went wrong – this can become tedious and complex depending on how the Matillion jobs are built. If only there was an automated way to access this data…
Task History: The API
Matillion’s API has a number of endpoints for tasks, including task history. This means that the data one sees in the task history UI can be programmatically retrieved and returned as JSON. This enables retrieving and storing this data to monitor and analyze the health of running processes on a Matillion instance in a much more automated fashion than a human manually looking within the UI.
Ingesting to the Warehouse
There are two resources of particular interest from the task history API: task detail, and task summary. The task summary resource provides job-level summaries on runtimes, whether the job ended in success or failure and some other metadata related to environments and versioning. This resource is useful to monitor processes at the job level. The task detail resource provides component-level data on runtimes, success or failure and other metadata for components within jobs. This resource is useful when monitoring jobs that are made up of multiple individual components, as it provides that component-level detail within jobs so it is possible to focus on components that failed.
The ETL process to ingest the task history data from Matillion’s API follows an incremental stage to target approach.
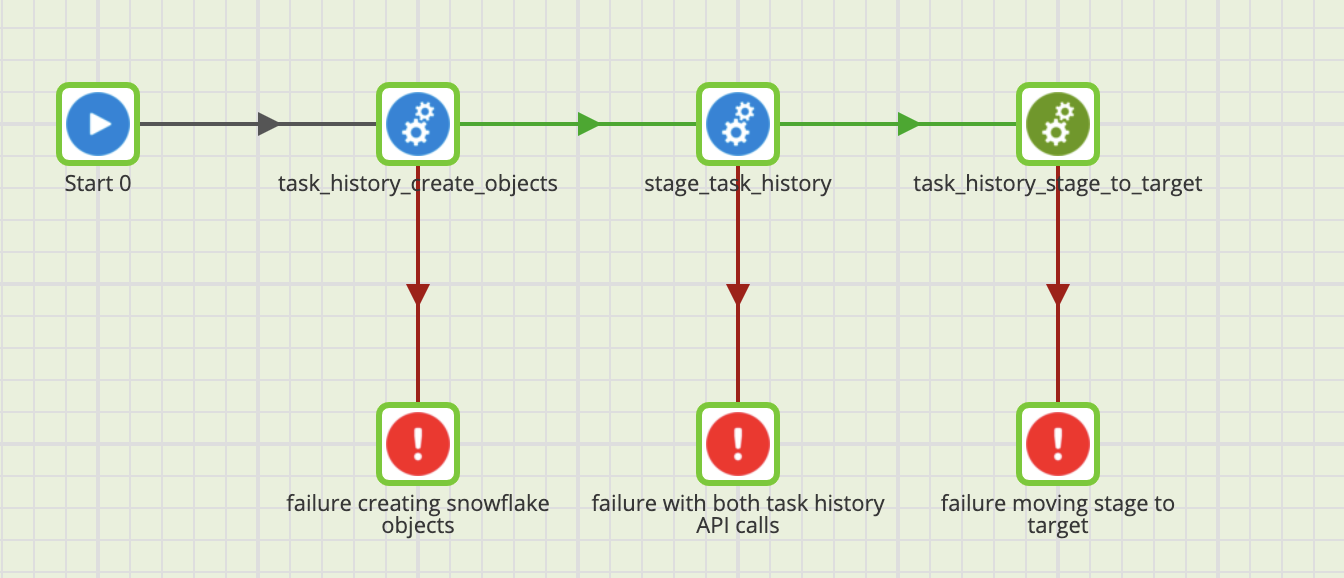
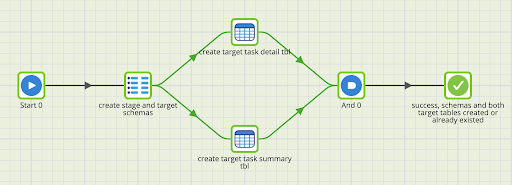
task_history_create_objects is a helper job that creates the stage and target schemas as well as the target tables if they do not exist. These object creations are driven by environment and job variables allowing for control over object naming depending on what environment this app runs in and without hardcoding values that would need to be maintained in multiple places.
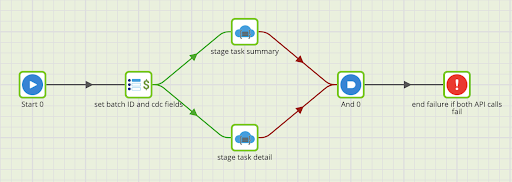
stage_task_history handles querying the target tables to determine the latest task history end times, which is then used when querying the Matillion API to land the new task history data in the staging tables where the start time > max end time. The API Query components handle the staging table creation including schema changes and truncating which is why those steps are not included in the object creation orchestration.
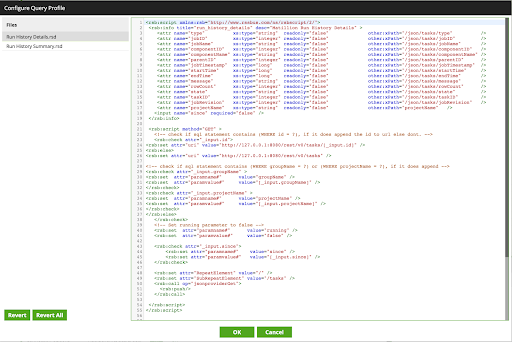
The API Query components use query profiles for the Matillion API, and Matillion includes configurations in the form of RSD files for the task detail and task summary resources that abstract the conversion of the JSON responses into a table-like format.
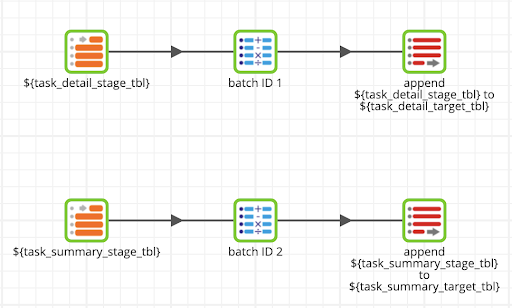
Finally, task_history_stage_to_target handles appending the new task history and task detail records that landed in the staging tables into the target tables. The component names with the job variable syntax illustrate how this is parameterized.
Applications
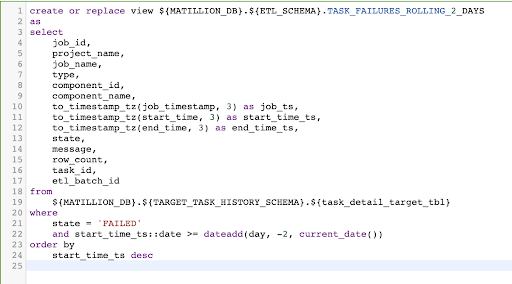
Once the data lands in the target tables it is almost ready for use. In one implementation, we wanted to focus on component-level failures in a production environment in order to quickly be able to identify which piece(s) of a larger job were failing. To accomplish this, a view was created in Snowflake which:
- Filtered task detail records to only those that ended in failure
- Cleaned up timestamp fields that Matillion returned as milliseconds to a more human-friendly format
- Included a rolling two day window so that only recent errors would be included
This gave us an object that could be queried and quickly display failures in the production environment, but it still meant having to manually execute a select statement and review the results.
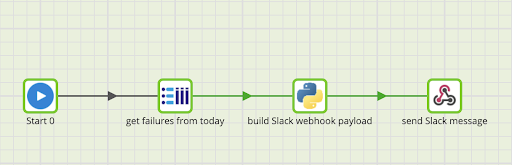
We ended up leveraging Slack webhooks to post messages to a channel with failures and the error message(s) associated with them. Because this implementation only had jobs that were scheduled once per day, we built a messenger orchestration in Matillion that queried the view we created to get the error details from the current date, converted it into a format that Slack’s webhook endpoint expected with Python, and finally posted that JSON string to the Slack channel’s webhook URL.
Conclusion
By now I’ve hopefully demonstrated how we’ve implemented an automated ETL process to ingest task history data from Matillion’s API and leveraged it to receive alerts to production failures in a hands-off fashion. There are numerous other benefits and possibilities once this data lands in the warehouse, including but not limited to:
- More frequent alerting – if jobs are running multiple times per day, it would be redundant to post messages with the same errors over and over again. Instead, consider using Matillion’s automatic variable task_id to isolate a messenger orchestration to only pull the task detail for that particular task ID.
- Matillion health dashboard – since this data lands in tables in the warehouse, a BI or front end tool can connect to them to build a dashboard that highlights the status of jobs from the Matillion instance.
- Email alerts – an alternative to posting data to a webhook endpoint.
Ultimately this has saved developer time that previously went to manually monitoring production jobs and allowed us to detect and resolve errors before there was a noticeable impact to stakeholders and end users.
If you would like to have Data Clymer help you with the development of your Modern Data Stack, please contact us at sales@dataclymer.com or fill out our Contact Us form.

Zak is a cloud data engineer focused on using his experience with SQL and Python to build analytics tools that help solve business problems.