Looker is an excellent tool for creating data visualizations. Unfortunately, slow Looker dashboards and slow Looker query runtimes can cause users a lot of frustration. Check out the proven strategies below to improve your Looker dashboard performance.
Want more help? Get hands-on support with a Looker Health Check. Data Clymer has helped dozens of organizations improve Looker dashboard performance so they can get the most value out of their data.
3 Looker Strategies
Strategy 1: Single Value Visual Query Consolidation
First, you’ll need to understand a few basics about single value visualizations. Looker’s documentation on Single Value Charts explains:
“The single value visualization always displays a value from the first row. Use sorting and filtering as needed so that the desired data is in the first row. A single value visualization uses, in priority order:
- The leftmost measure
- The leftmost table calculation based on a measure
- The leftmost dimension
- The leftmost table calculation that does not involve a measure
You can change which field is used in the visualization by dragging fields to change their position, or by hiding fields from the visualization that you don’t want displayed.”
We commonly see setup errors here.
When using optimized single value visualizations, each visual should include all fields that have single value visuals in the dashboard that are coming from the same Explore in their data panes. You will just hide and unhide the field you want to see in each particular visual. This creates identical SQL queries on every single value visual so the results are cached and can be reused rather than each one needing its own query.
How to Consolidate Single Value Visual Queries: Step-by-Step Instructions
-
- Open the Explore of your first single value visualization.
- Add all fields from that Explore that also have single value visualizations in that dashboard.
- Hide all fields besides the first field, change the visual type to single value visualization, and save as your first single value look. Add to the dashboard.
- Explore from here on Look from the previous step, hide all fields besides the second field, and save as your second single value Look. Add to the dashboard.
- Continue this process until all necessary fields from that Explore have their own visual.
- Follow the same process with fields that live in other Explores.
Strategy 2: Build a Filtered Field in LookML
LookML is meant to be the source of truth and a reusable asset. Use this strategy to make sure logic is maintained in the LookML rather than at a visualization level.
For example, when you want to see a count of terminated contracts, you want to create a measure in LookML that counts contracts and add a filter parameter with terminated = ‘Yes’ rather than creating a look that has the contract count measure with a collected = ‘Yes’ filter.
Correct:
measure: terminated_count {
type: sum
sql: ${contract_count} ;;
filters: [is_terminated: "Yes"]
Incorrect:
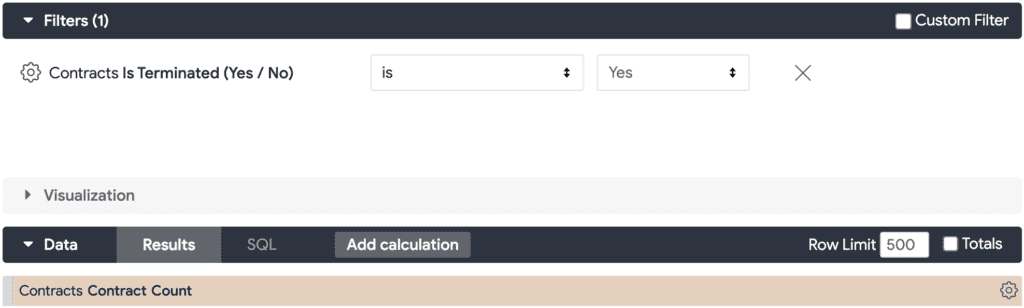
You can use this strategy alongside the single value visualization strategy. Since the goal when combining single value visuals is to be able to have many metrics with different logic run in the same Look, it would not be possible to include filters unless they apply across all metrics. Therefore, you can only add metric-specific logic in the LookML rather than by using the Explore filters.
Strategy 3: Moving Logic to PDT SQL
First, some background. What is a PDT and how do they help reduce query time and database load?
Looker’s documentation on Persistent Derived Tables (PDTs) explains:
“A persistent derived table (PDT) is a derived table that is written into a scratch schema on your database and regenerated on the schedule that you specify with a persistence strategy.
A PDT can be either a native derived table or a SQL-based derived table.
PDTs are helpful because when the user requests data from the table, often the table will have already been created, reducing query time and database load.”
When you are using a PDT for materialization, it only materializes what is included in the SQL statement in the PDT at the top of the view. Any logic added to dimensions and measures within the view’s LookML will be processed as the field is used in the Explores and visualization. So if you want to make an Explore run even more quickly, you will want to move long case “when” statements or complex logic into the PDT SQL. This way, it will be cached along with the rest of the table.
Looker Slow? Get Expert Tips to Improve Looker Performance
These three strategies are just a few of the ways Data Clymer helps organizations optimize the performance of their Looker dashboards. If you’d like help improving your Looker dashboard performance, contact us for a Looker Health Check. Our team of Looker experts can uncover issues that slow down performance. We’ll walk through detailed recommendations and an implementation plan to speed up Looker so you can get back to work!
Angela Gomez-Mesquita
Angela is a business intelligence expert who is passionate about building internal and external business relations. She obtains this through positive and effective communications and through building tools to improve data insight.